Once again, Fox News is leading you to believe that Latino support for Donald Trump is increasing, even during the shutdown. In a piece titled “Poll: Trump Gains Approval From Latino Voters Since Gov’t Shutdown,” Fox states this: “Latinos are increasingly rallying for President Trump, according to data from a new NPR/PBS NewsHour/Marist poll. The poll notes that 50 percent of Latinos surveyed approve of the job Trump is doing, a 19-point increase from December of last year.”
Sounds pretty clear, right?
Not really, especially when one looks at the actual poll, which will confirm that all this “data” is based on 154 Latino respondents.
154.
What follows is an explanation about the 154 number.
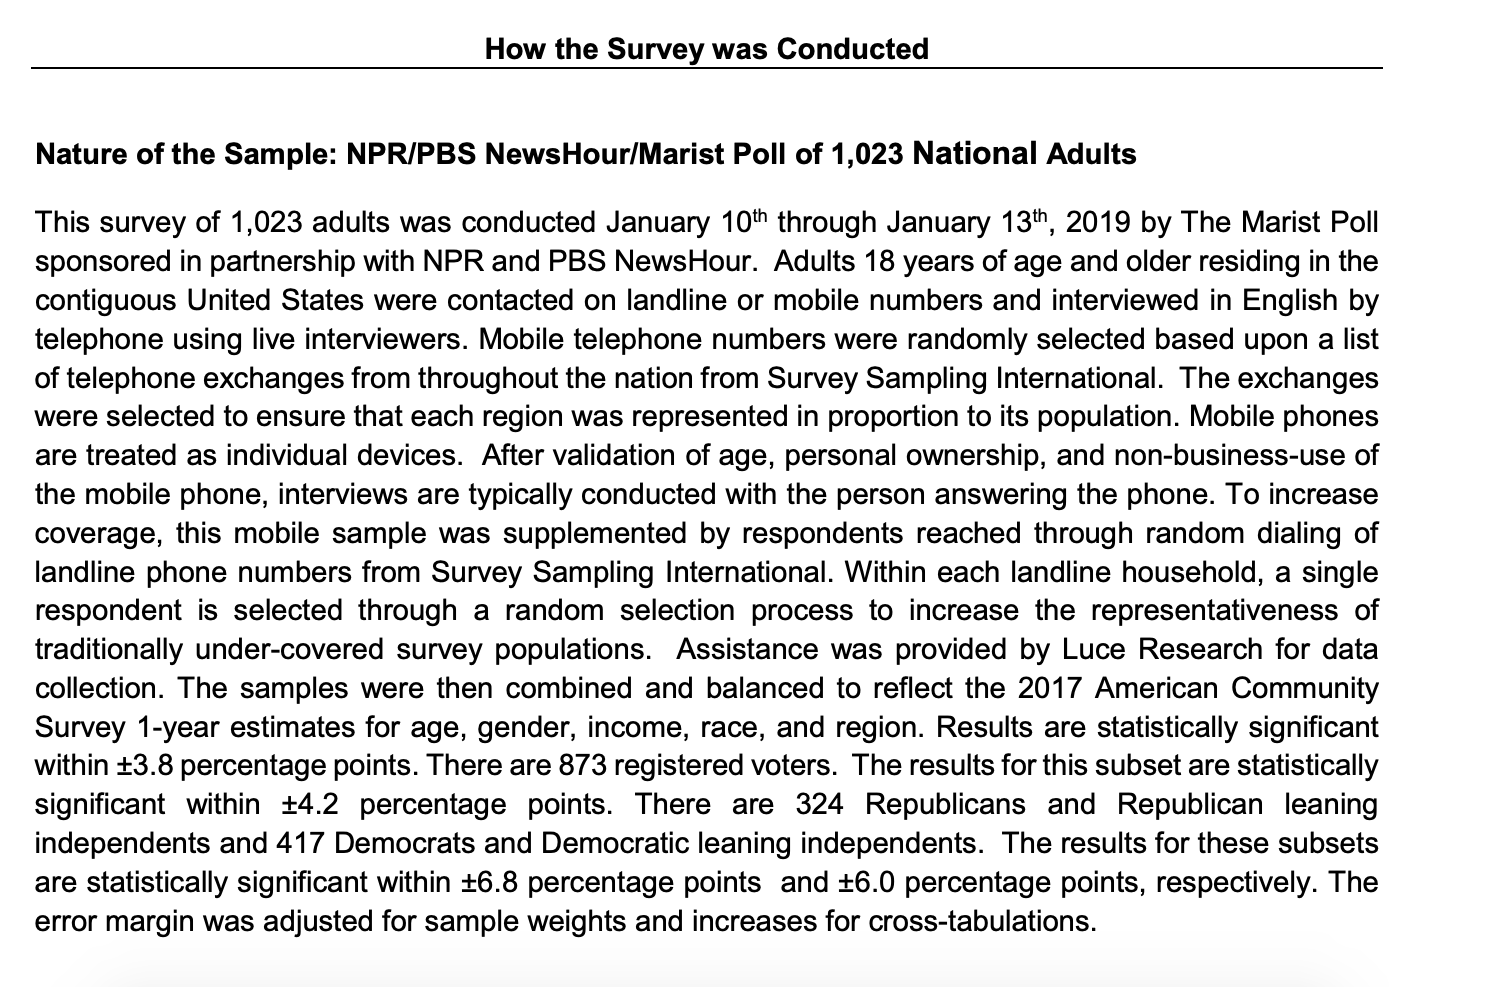
Page 1 of the poll tells you how many people got surveyed. That would be 1,023 people.


Page 2 shows the demographic breakdown of the total number of people surveyed. Notice that under “Race,” (and yes, Latino is not a race), the poll states that 15% of respondents are Latino.


So, 15% of 1,023 people is 154 people.
154 people is not a national poll? We’ve done Twitter polls with more respondents. And considering that NPR/PBS NewsHour/Marist cite “Latino” as a race, do you think their survey reflects a real cross-section of the Latino community?
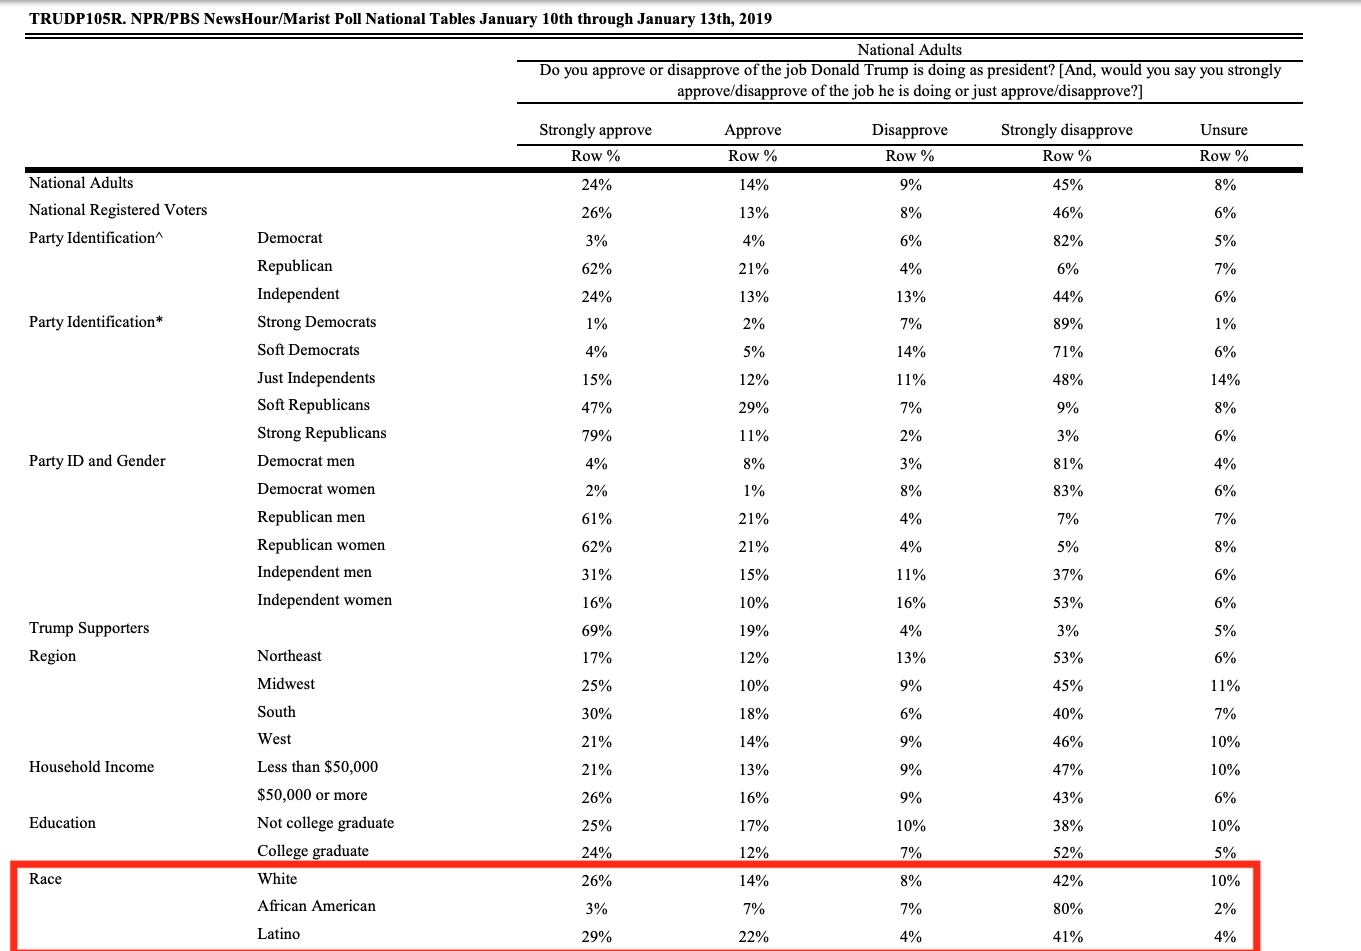
And, even if the poll says that 50% of Latinos polled (that would be 72 people, by the way) approve of Trump’s performance right now, the level of approval varies. See this from the actual poll:


In that column, 29% of Latino respondents (that’s about 45 people) strongly approve of Trump, while 41% of Latino respondents strongly disapprove (that’s about 63 people).
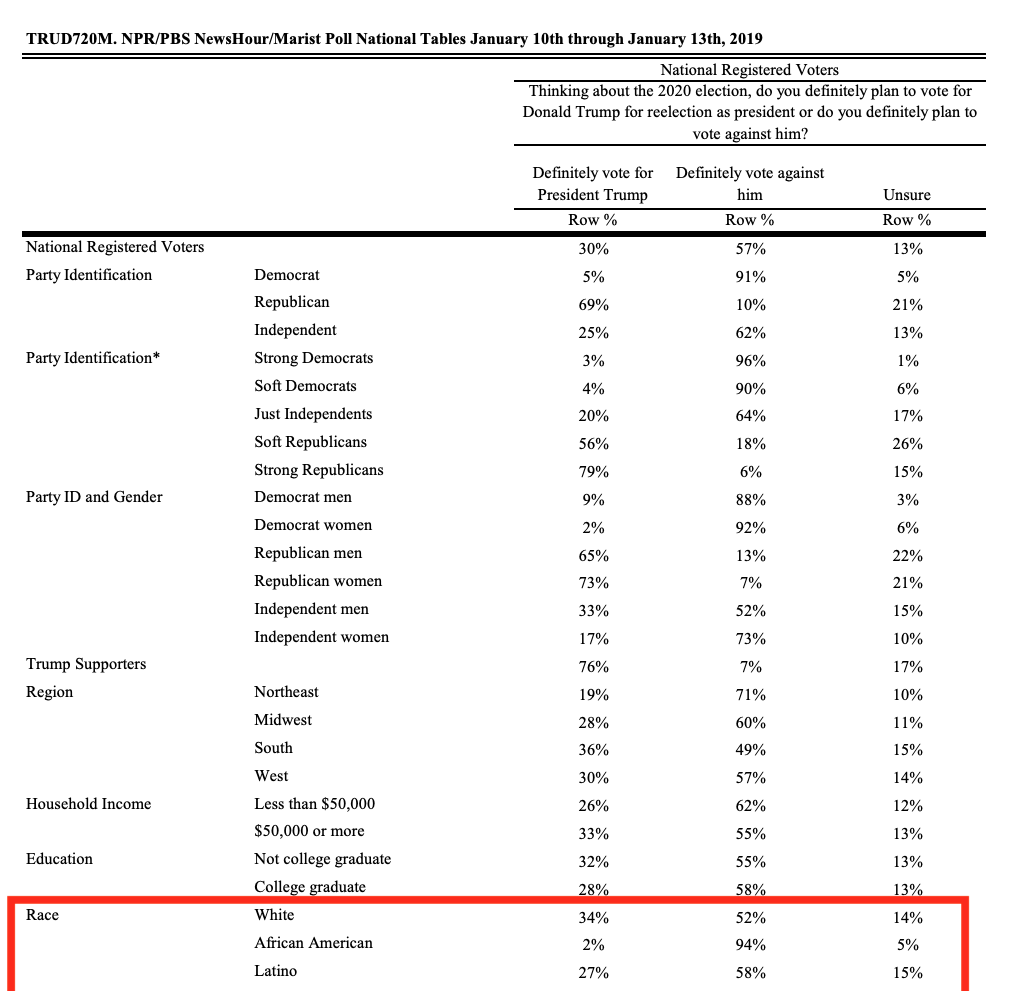
And if Trump’s approval was high, how then does one explain this part of the poll, which asks is someone would vote for Trump in 2020:


As you can see, only 27% of Latinos (42 people) said they would vote for Trump, while 58% of Latinos (101 people) said they would not vote for him.
(We are also pretty sure that this poll was conducted in English only and didn’t even take into account any Spanish speakers.)
So spare us this “news” that Trump’s approval with Latinos is growing.
It’s not.
But we would be sure that if NPR/PBS NewsHour/Marist actually conducted a Latino-centric poll with more than 1,000 respondents, the results would be very different. That’s for sure.
UPDATE, January 22, 2019, This in from NPR Politics reporter Tamara Keith:
.@tamarakeithNPR just mentioned on @MSNBC that poll organizers of NPR/PBS Newshours/Marist poll said Latino sample had more Republican Latinos than usual.
Also, it's just 154 Latinos.https://t.co/5ID4aqNTKJ
— Julio Ricardo Varela (@julito77) January 22, 2019


While I agree – most everyone agrees – the numbers are surprising, you seem to misunderstand how statistics work. We don’t need 1,000 Latinos to represent the Latino community reasonably; that’s why “only” some 1,000 people are surveyed for the whole US. And speaking to that the approval/disapproval number can’t be simply waved off as a misrepresentation is the simultaneously predictable/expected numbers re voting for/against Trump in 2020 intention.
It may be that Latino voters really are more approving of Trump’s performance as related to better employment. Or perhaps numbers among some subset of non-Central American-originating Latinos has soared even more strongly re approval, feeling disconnected from the “wall issue” and feeling Trump is doing generally better while still not wishing to vote for him. We don’t know
But we also cannot just dismiss that it was 154 Latinos who took the poll. . I did a social research course in college, for the city of Boston for a very reliable survey one only needed some 40 people – if suitably representative and random. For 154 Latinos when compared to the 29 million “registered” (as opposed to actual) voters the Margin of Error is a little under 8%. Which makes sense as the poll, while not addressing its Latino population sampling margin of error notes “Results are statistically significant within ±3.8 percentage points. There are 873 registered voters. The results for this subset are statistically significant within ±4.2 percentage points. There are 324 Republicans and Republican leaning independents and 417 Democrats and Democratic leaning independents. The results for these subsets are statistically significant within ±6.8 percentage points and ±6.0 percentage points, respectively.”
Note that a ~7% MoE puts the results for Latino in the same range as prior results and suggests not an anomaly but actually a result within the margin of error.
You are proving our point, and spare us the lecture about how we don’t know statistics. Also, the poll was conduced in English only, which alone would mean that it is not reflective at all of the U.S. Latino community. And you didn’t even address the point that if Trump’s approval is so high, why are these same Latinos not voting for him? So thanks for trying to “disprove” our premise, but you are just not convincing us and we stand by our analysis. Buy hey, what do we know, right?
Perhaps they are not voting for him , because they have been propagandized by Socialists and Leftist in the media .
Most thinking Latinos know they have never had it so good and are thankful . Plenty of jobs and opportunities for advancement unlike other Latin American Countries . Most of them are grateful to be Americans and have what they have
Speaking about not understanding statistics! What you are really speaking of is not statistics but rather how to properly draw a sample. The Latino community is extremely diverse and geographically clustered in a very odd fashion across the United States. What this survey shows is a haphazardly drawn sample of Latinos rather than a randomly, stratified sample of Latinos. This runs the risk of oversampling Latinos from one geographical area and of one national origin group.
[…] have gone through this before—how President Trump, the White House and their media allies have cited national polls with extremely small U.S. Latino samples to claim that the nations’s largest ethnic group is fully behind the current […]