
(Photo by BRENDAN SMIALOWSKI/AFP/Getty Images)
With the primary season heading into Nevada, South Carolina and then Super Tuesday, we wanted to take a moment and share some data about U.S. Latino voters that Pew Research published over the last few weeks.
Latino Share of US Electorate Grows
According to Pew’s analysis, “a record 32 million projected to be eligible to vote,” accounting for “13.3% of all eligible voters.”
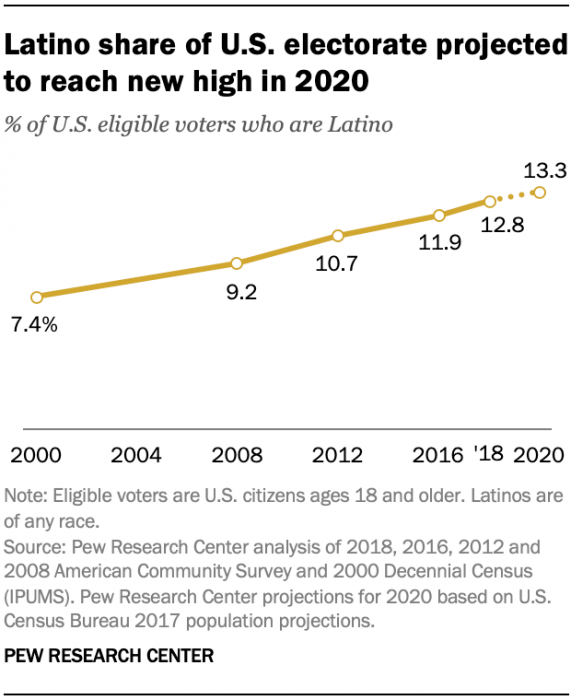

That’s a pretty significant number but Pew also noted that “the number of Latino eligible voters is still far below the 60 million Latinos who live in the country.”
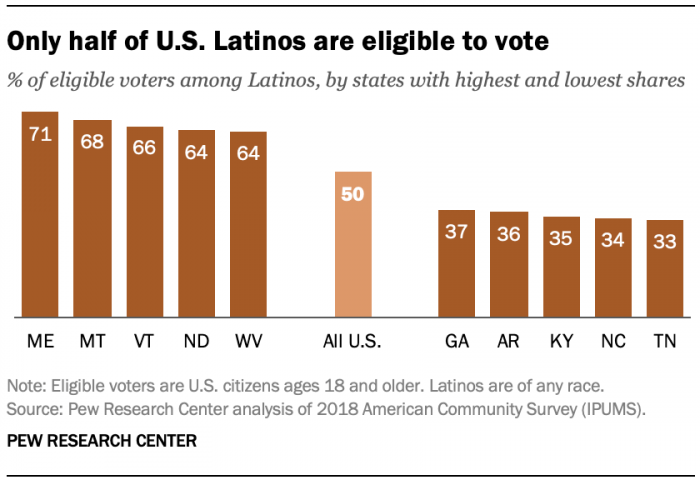

Still, Pew noted that U.S. Latinos can still play a role in upcoming Democratic primaries.
“A majority (56%) [of Latinos] live in states that will hold Democratic primaries and caucuses on or before Super Tuesday (March 3), up from 29% in 2016. Nationally, 62% of Latino registered voters identify with or lean toward the Democratic Party while 34% say the same about the Republican Party,” Pew said.
Where Do These Eligible Voters Live?
According to Pew, the top five states with the most Latino eligible voters are California, Texas, Florida, New York and Arizona. New Mexico, however, has the largest share (43%) of eligible voters.
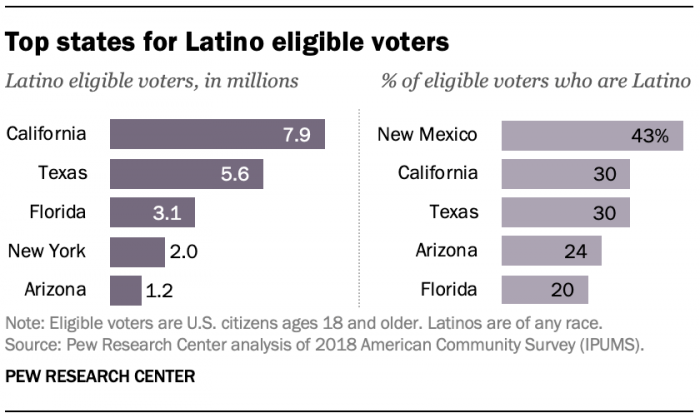

Pew has also created an interactive map that shows U.S. Latino eligible voters across individual states and congressional districts. It is a data dream. Click here to start exploring.
Primaries, Democrats and Republicans
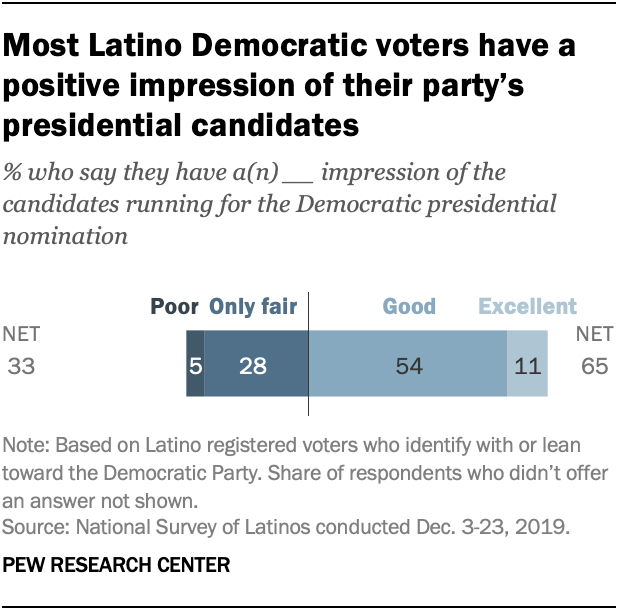
Pew has also looked into Democrats, Republicans and presidential primaries. It noted the following: “Among Latino registered voters, almost nine-in-ten Democrats and Democratic leaners (87%) say it really matters who wins the White House. When asked about candidates seeking the Democratic presidential nomination, a majority of Latino Democratic and Democratic-leaning voters say they have a good (54%) or excellent (11%) impression of them. A third say they have an only fair (28%) or poor (5%) impression of the candidates.”

In terms of political parties, “about half (53%) [of Latinos] say the Democratic Party has more concern for Latinos than the Republican Party, while 31% say there is no difference between the two parties. Just 15% say the GOP has more concern for Latinos than the Democratic Party.”
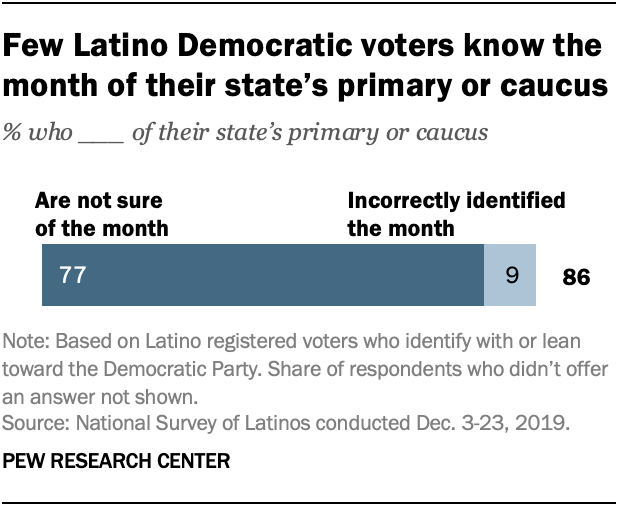
As for presidential primaries, Pew concluded that a vast majority of Latino Democrats weren’t sure of their respective state primary or caucus.
“When asked to identify the date of their state’s primary or caucus, 86% say they are either unsure of the month (77%) or incorrectly identified the month (9%),” Pew noted.

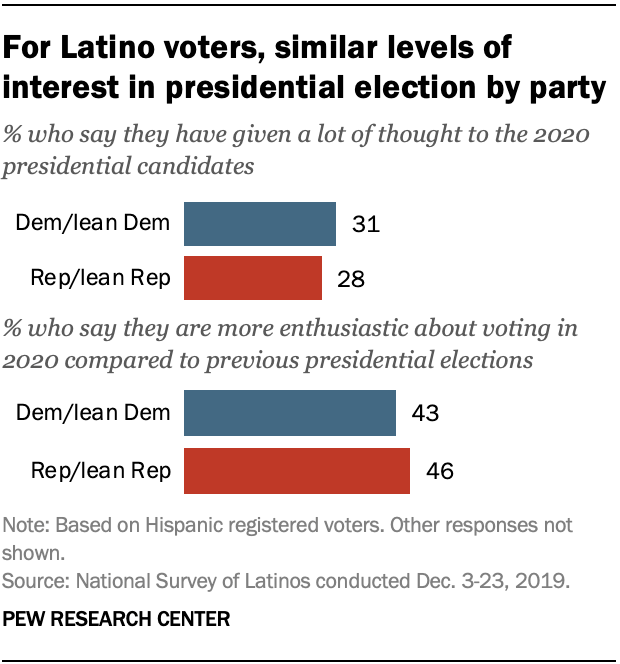
Still, there is some enthusiasm for the 2020 elections.

What About Trump?
Pew also asked about how U.S. Latinos view President Trump. It said the following about the president’s approval: “Overall, Latino registered voters hold negative views of President Donald Trump and the nation’s direction, with views sharply divided along party lines. About two-thirds of Hispanic registered voters (68%) disapprove of the job Trump is doing as president, including 51% who disapprove very strongly. The 30% of Hispanic voters who approve of Trump includes 23% who approve strongly.”
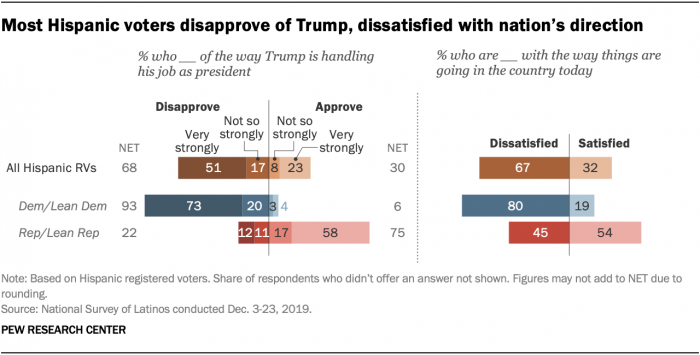

When broken down by political party, 93% of Latinos who identify as Democrat or lean Democrat disapprove of President Trump’s job. On the flip side, Trump has a 75% approval rating with Latinos who identify as Republican or lean Republican.
“Similarly, satisfaction with the nation’s direction is tied to party identification,” Pew noted. “Overall, 67% of Latino registered voters say they are dissatisfied with the way things are going in the country today. But among Democrats, 80% say they are dissatisfied with the nation’s direction, compared with 54% of Republicans who say they are satisfied.”


[…] According to Pew, “A majority (56%) [of Latinos] live in states that will hold Democratic primaries and caucuses on or before Super Tuesday (March 3), up from 29% in 2016.” […]