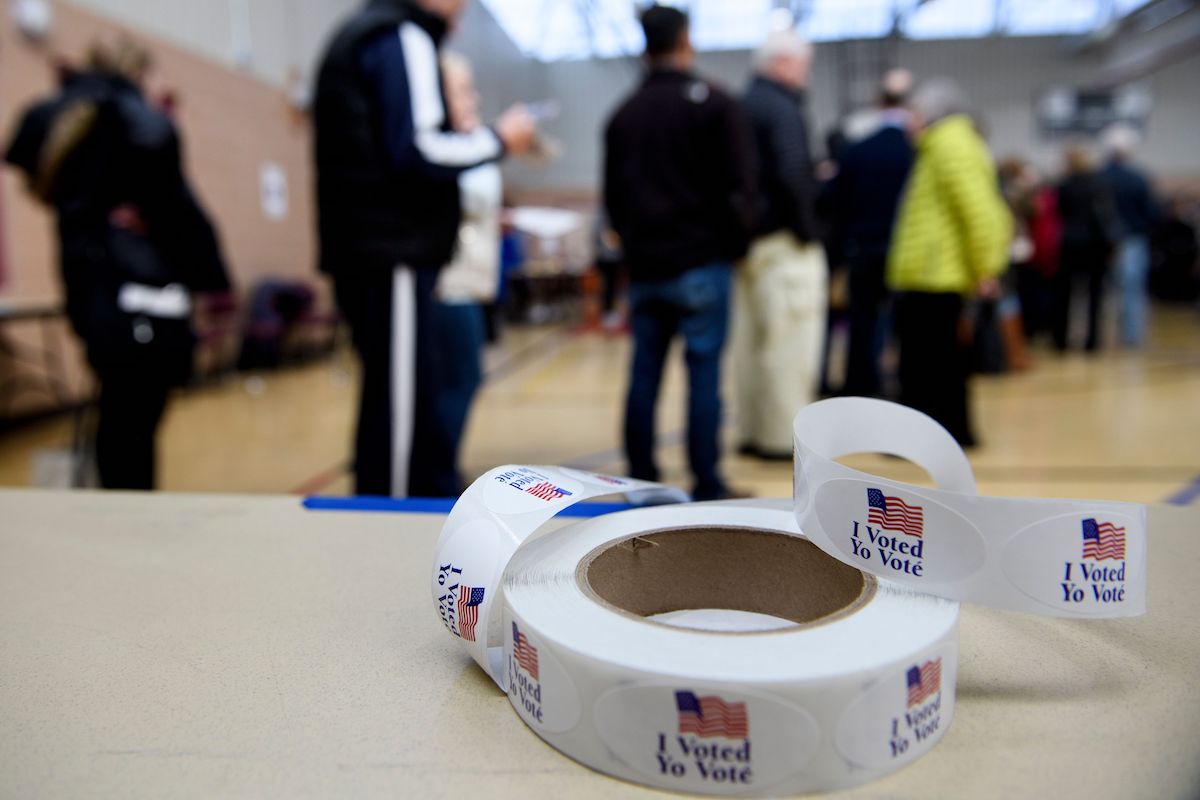

People wait in line during early voting at a community center October 25, 2018 in Potomac, Maryland. (Photo by BRENDAN SMIALOWSKI/AFP/Getty Images)
By Adrian Pantoja
The recent purge of over 100,000 persons from Georgia’s voter rolls illustrates the ongoing efforts by Republicans to roll back voting rights for minorities. Although the history of voter disenfranchisement frequently focuses on southern states and African Americans, it is important to note that many other groups, including Native Americans, Asian Americans and Latinos, are targets of voter suppression laws. The 2013 Supreme Court decision on Shelby v. Holder gutted key provisions of the Voting Rights Act and has led to an increase in voting obstacles such as strict voter ID requirements, voter purges, limits to voter registration, and the closure of polling places in minority communities. Donald Trump’s claim that he “won the popular vote if you deduct the millions of people who voted illegally” has intensified the assault on voting rights. Are Latinos, the nation’s largest minority group, encountering significant barriers to voting and/or voter registration? The degree to which Latinos and other minority groups face such obstacles could shape the outcome of many races this November. Perhaps more importantly, the political consequences of these barriers extend far beyond this election as limits to voting strike at the heart of our democracy.
Breaking down barriers to voting is central to many civil rights organizations. Latino Decisions, in partnership with the National Association of Latino Elected Officials (NALEO), has conducted a number of studies investigating the effects of voting restrictions on Latinos. In our most recent effort, the 2018 tracking poll included a question asking respondents if they have faced any one of seven barriers to voting or registering to vote in previous elections. A similar question was asked in the 2016 tracking poll. Those results are included for comparison purposes. Although these are retrospective evaluations, the responses given provide some indication of impediments Latinos may face this November.
![]()
![]()
The results show that the most common hurdle remains experiencing long wait times at polling stations. At first glance this may seem to be an innocuous barrier facing many voters across the country. However, a number of studies and reports are finding that not all Americans are equally impacted. Closures and limited availability of polling stations are disproportionately effecting minority communities. Voting is a costly endeavor for many working-class Latinos; balancing work and family obligations and long wait times is an additional obstacle they must overcome if they are to vote on Election Day. Our data show that the number of Latinos experiencing long wait times at the polls is on the rise. This November, wait times could increase if Republicans continue to reduce the number of polling stations in Latino precincts.
While the other voting barriers are experienced at lower rates than they were in 2016, they are by no means inconsequential. For example, the 2018 poll shows that 12% could not get information or assistance in Spanish, 13% were told they could not vote, 11% said their names were not on the voter file, 15% were told their registration was invalid and 15% said they went to the wrong precinct. Finally, 10% said the identification they provided was considered invalid. Although most of these figures are lower than those reported in 2016, the differences fall within the margin-of-error of 4.4%, suggesting little to no change. Nonetheless, there is a significant drop in the number of respondents noting that they were told they could not vote (18% in 2016 to 13% in 2018). Despite the decline to 13%, this is not an insignificant figure considering that there are an estimated 16 million registered Latino voters. If 13% of Latinos are prevented from voting, this could be decisive in shaping many electoral races this November.
In the survey, respondents were asked if they had experienced each of the seven barriers listed, making it is possible for a single individual to have faced more than one of these obstacles. Overall, we found that 25% experienced two or more of these barriers and 46% experienced at least one of them. In other words, close to half of Latino registered voters have confronted some type of impediment for engaging in the political process. Whether this barrier ultimately kept them from voting is difficult to discern from the data. Nonetheless, civil rights groups, candidates, and parties should be watchful of these existing obstacles.
According to the Brennan Center for Justice, since 2010, 24 states have enacted some type of measure that makes it more difficult for some groups to register to vote and/or vote. Four of the states on that list, Arizona, Texas, Illinois and Florida, have sizable Latino populations. Many others on the list have rapidly expanding Latino populations. It comes as no surprise that Latinos are now at the forefront of many voting rights litigations. These controversies are likely to increase in the foreseeable future given the Shelby v. Holder decision and Donald Trump’s victory. Our 2016 and 2018 tracking polls show that electoral barriers facing Latinos are wide-ranging and fluctuate across time. We suspect there is variability across states, districts, and subgroups within the Latino population that is worthy of further exploration. The fact than nearly half of Latinos report facing one of those barriers should give us pause as millions may become disengaged from the political process. Nonetheless, rolling back minority voting rights impacts more than the targeted groups. These laws threaten the vitality of our democracy and the viability of the party enacting them, as rising minority voters will direct their ire toward those moving to politically disempower them.
Methodology. On behalf of NALEO Educational Fund, Latino Decisions interviewed 500 Latino registered voters nationwide from August 28 – September 3, 2018 and carries of margin of error of 4.4%. Each week, for the next nine weeks, a fresh sample of 250 registered voters is added and combined with the previous 250 interviews to create a rolling average for each week, consistent with most tracking polls methodology. Respondents were randomly selected from Latino Decisions partner web panels and confirmed to be registered to vote. The survey was self-administered and available in English or Spanish at the discretion of the respondent. Data were compared to the best known estimates of the U.S. Census Current Population Survey (CPS) for demographic profile of Latino registered voters and weights were applied to bring the data into direct balance with Census estimates.
***
Adrian D. Pantoja, Ph.D., is Senior Analyst at Latino Decisions and Professor of Politics at Pitzer College.


